Web Mapping Tutorial with Python and Folium
This Folium tutorial shows how to create a Leaflet web map from scratch with Python and the Folium library. For more explanations on how the code works, please watch the video further below.
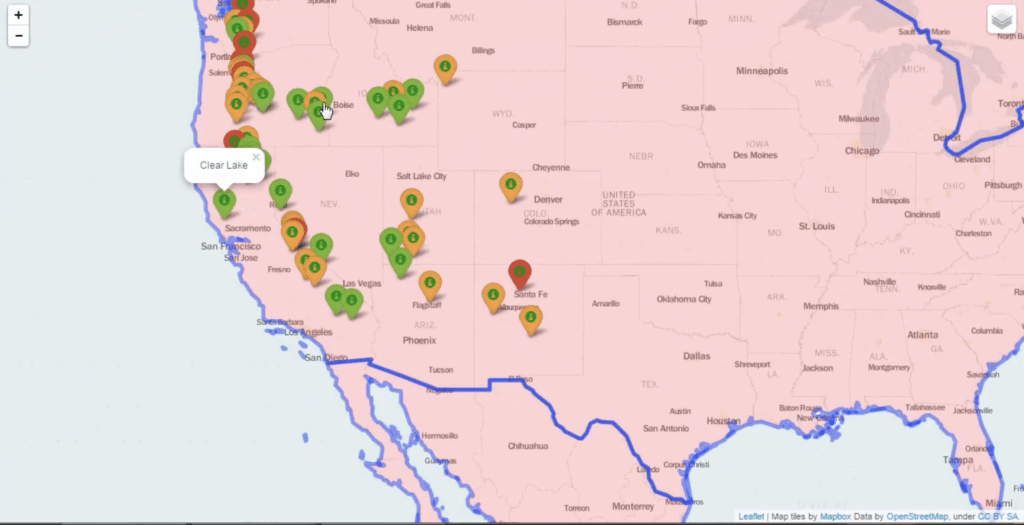
Here is how the map will look like (may need a few seconds to load):
If you don’t want to watch the video, here is the tutorial in a nutshell:
To make the map you need to have Python and the Python pandas and folium libraries installed:
pip install pandaspip install foliumYou also need the following two files. We will use them as data sources for the tutorial. You can download the files below:
If the above files open in your browser, try right-clicking over them and then go to Save As to save them as local files.
Once you have Python, pandas, folium, and the data, place the data in a folder, create an empty Python script in that same folder and put the code below in that script.
Executing the Python script should generate a map.html file in your folder. Later, you can simply put that HTML file on a live server and have the map online.
If you look inside the map.html source code you will see that Folium has been able to generate HTML, Javascript and CSS and these three render the map on the browser. You can serve this HTML as a static file in a basic webserver, but you can also go more advanced and create a Python application and have Folium dynamically generate such Leaflet maps on demand.
If you want to learn how to build more cool programs like the one below, don’t miss The Python Mega Course: Build 10 Real World Applications.
Table of Contents
Recommended Course
Python Mega Course: Learn Python in 60 Days, Build 20 Apps
Learn Python on Udemy completely in 60 days or less by building 20 real-world applications from web development to data science.